

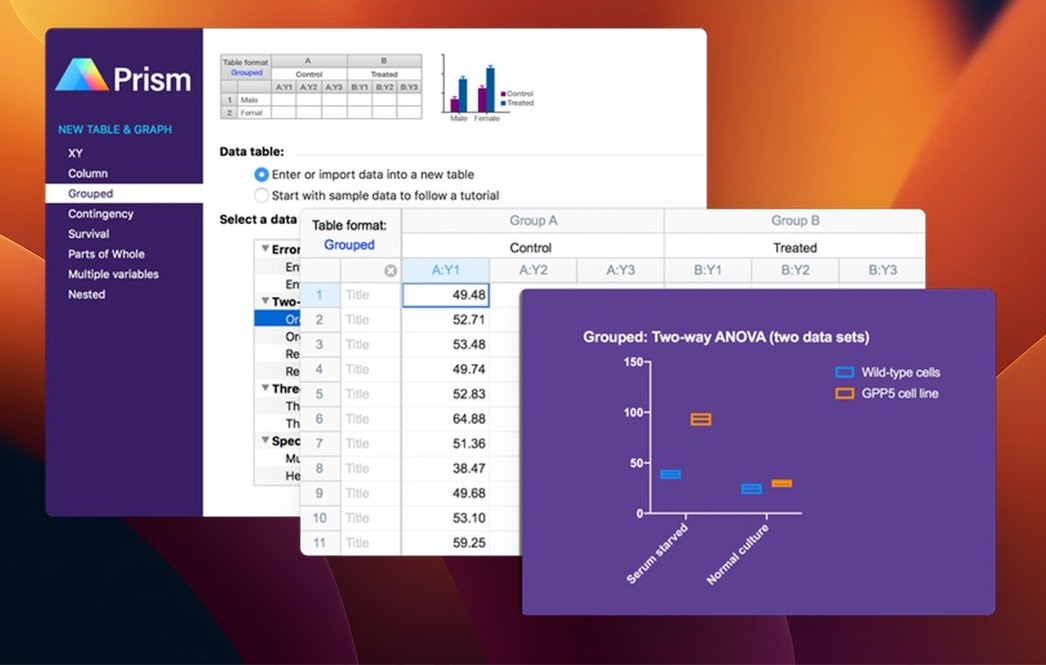
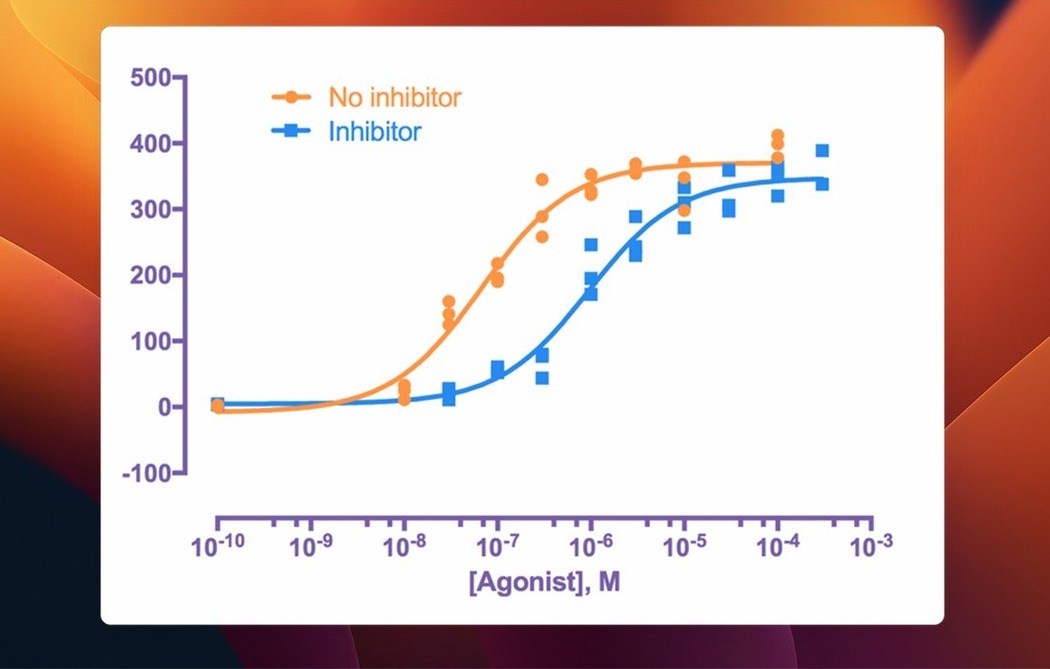
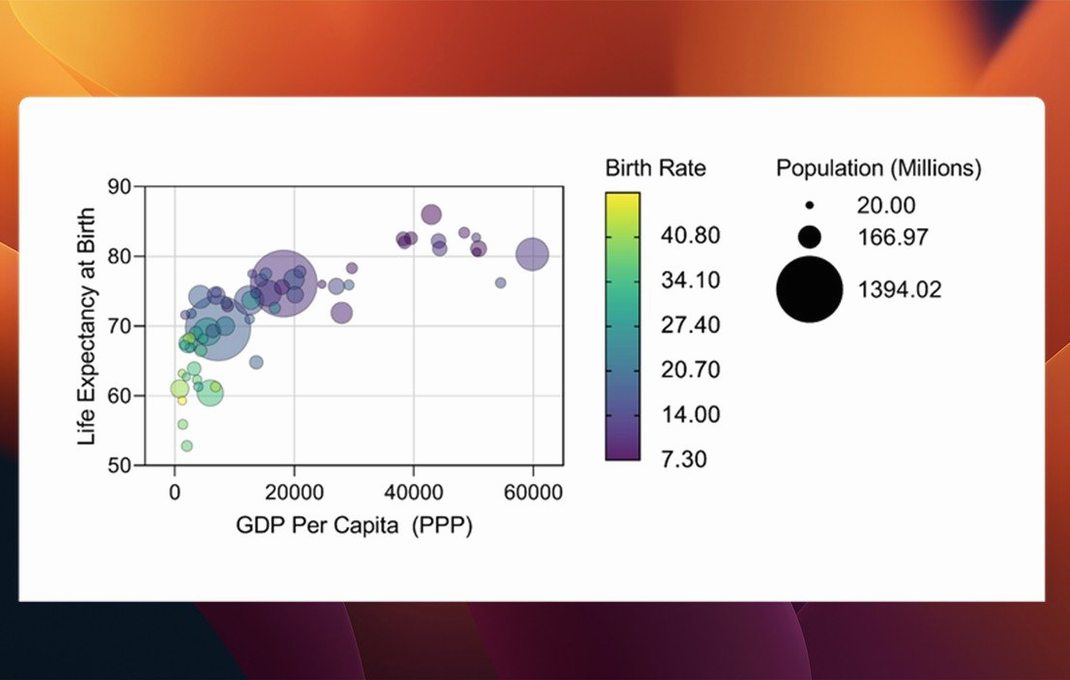
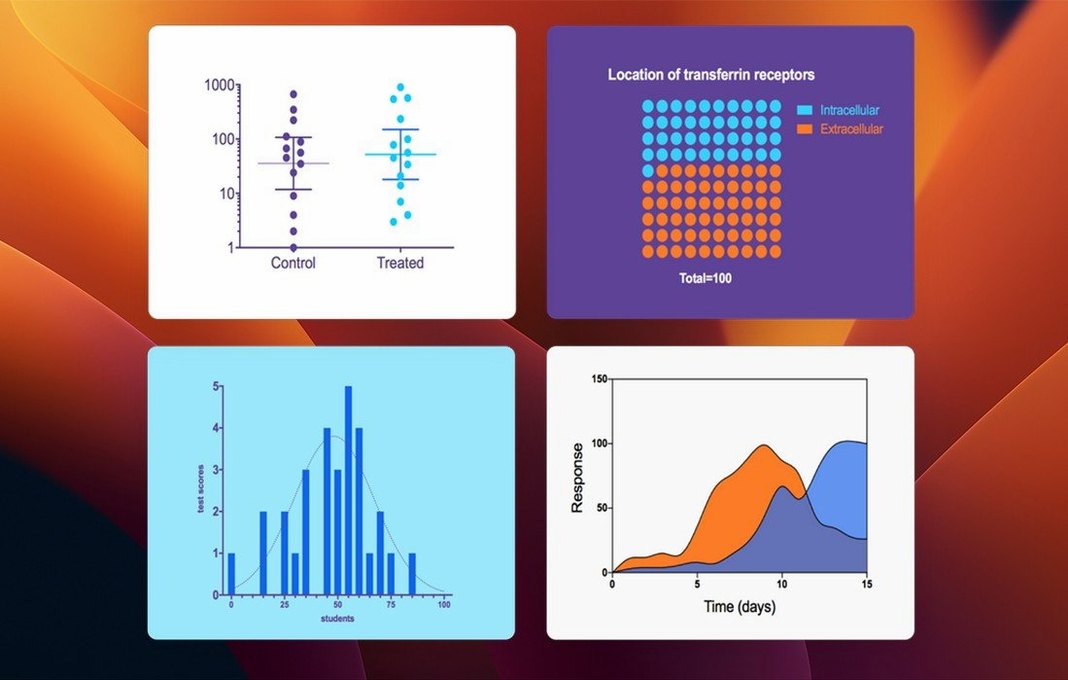
A researcher imports a repeated experiment with multiple variables, picks a t test from the analysis menu, and gets a graph with a recommended test and interpretation notes. That's Prism's daily loop: statistics, curve fitting, and graphing in one place, without moving data between separate apps.
Runs on Apple Silicon and Intel Macs
- Runs on Apple Silicon and Intel Macs, so it works beside other tools in your workflow.
- Organizes, analyzes, and displays repeated experiments in a single project file, reducing the need to hop between a spreadsheet and a plotting app.
- Includes guidance for choosing statistical tests and interpreting results — useful when you're not a dedicated statistician.
- Available for both Windows and Mac, making it easy to share files with collaborators on either platform.
New graph types for multiple variables tables
The current release adds graph types for multiple variables tables, including bars, box-and-whisker plots, and violin plots. It also introduces categorical level ordering for that data, and streamlines variable selection in dialogs for t tests, multifactor ANOVA, nonlinear regression, and simple survival analysis. More than 60 bug fixes are included. Interface language is English.
The analysis menu suggests a statistical test based on your data
Prism doesn't advertise every shortcut. A few are worth knowing:
- The analysis menu suggests a statistical test based on your data table structure. If you have a repeated-measures layout, it filters out tests that don't apply, saving you from reading through the entire list.
- Graphs and results are linked to the source data. If you edit a value in the data table, the graph and any curve fits update automatically. No manual re-plot.
- The “Results” sheet for each analysis includes a plain-text interpretation note. It tells you what the p-value means in your context, not just the number.
- Column info (units, number of replicates, column title) carries over when you copy a table into a new project. No re-entering metadata.
Exports graphs as TIFF, JPEG, or PDF to your macOS folders
Prism exports graphs and tables in common formats. You can copy a graph as a TIFF, JPEG, or PDF and paste it into a manuscript or presentation. The export dialog respects macOS folder locations, so it naturally defaults to your Documents or Desktop without extra navigation.
For data import, Prism reads text files and common spreadsheet formats. If your lab already stores data as CSV or tab-delimited text, you can drag those files onto the Prism icon in the dock to start a new project. The import wizard recognizes the delimiter and column headers automatically.
On macOS, the app uses the system clipboard, so you can paste data from Apple Numbers or a plain text editor directly into the data table. The paste operation matches columns by position, not by name, so ordering your source spreadsheet columns to match Prism's layout saves time.
Prism files are cross-platform. A project created on a Mac can be opened in the Windows version and vice versa. Fonts and graph dimensions stay consistent, as long as the same fonts are installed on both systems.
Drag to Applications, then open from Launchpad
Graph looks different from the data
Check the “Graph Settings” dialog for the graph type. If you selected a bar chart from a multiple variables table, Prism applies default grouping. To change the grouping, open the graph and switch the “Show” option from bars to points or to a box-and-whisker plot. The data remains the same.
Analysis dialog doesn't show all tests
Prism hides tests that don't match the structure of your data table. If you expect a paired t test but it's grayed out, your table likely isn't set up with matched pairs. Revisit the “Data Table” setup to define the replicate structure correctly, then re-open the analysis dialog.
License activation on a company network
Version 11.1.0 includes browser-based license activation for enterprise SSO environments. If the in-app activation window fails, open the link it provides in a standard web browser, complete the SSO login, and the activation proceeds. No need to contact IT unless the network blocks the activation domain.
Plot labels overlapping or cut off
Labels on violin or box plots can crowd together when you have many categories. In the graph's formatting panel, increase the chart margin or rotate the labels under “Axis” settings. Prism recalculates the layout instantly.
Data import fails on CSV files with commas inside quoted fields
Prism expects strict CSV formatting. If your file contains commas within quoted strings (e.g., “Jones, Smith”), switch the delimiter to tab or semicolon in the import dialog, or pre-process the file with a text editor to replace the field separator.
Pick “Multiple Variables” for a four-condition experiment
You open Prism from Launchpad after dragging it to Applications during setup. The welcome screen offers a blank project or a recent file. You choose “New Project” and pick “Multiple Variables” from the table types, because your experiment has four groups with triplicate measurements per sample.
The data table appears as rows for each sample and columns for each group. You paste the values from a CSV export of your lab's plate reader, column by column. The table auto-fills replicate rows when you enter them in a single column with commas, saving you from creating separate sub-columns manually.
With the data entered, you click “Analyze” on the toolbar. Prism lists the available analyses: you choose “One-way ANOVA” because the experiment compares multiple groups. The dialog now shows simplified variable selection, where you assign which columns are data and which are category labels. You set the first column as the category and the next four as data replicates, then click OK.
Prism computes the ANOVA and produces a results sheet with an F value, a p-value, and a plain-text interpretation. It also generates a default graph: a bar chart with error bars. You double-click the graph to open the formatting panel and change the plot to a box-and-whisker style to show the data distribution more clearly. The categories reorder themselves alphabetically, but you can drag the category labels in the data table to set a custom order — version 11.1.0 preserves that ordering when you re-plot.
You copy the graph as a TIFF file and paste it into the manuscript draft. The legend, axes, and significance annotations all come along. The project file saves as a single .pzfx file, which you email to a collaborator on Windows. They open it, adjust a data point, and send it back. The linked graph updates without any manual sync step.
The session ends with the file closed and the recent projects list ready for next week's dataset.
- Adds new graph types for multiple variables tables.
- Adds categorical level ordering for multiple variables data tables.
- Adds streamlined variable selection in analysis dialogs.
- macOS 11 or later
- Apple Silicon or Intel
Install procedure
- Open the downloaded disk image.
- Drag the app to the Applications folder.
- Launch the app from Launchpad after copying finishes.
Reports from players
Sign in or create a tester account to file a report.
No reports filed yet.